Visualising the Mandelbrot Set
25 Dec 2020 |fractals python Definition
The Mandelbrot set is defined as the set of all values $c$ in the complex plane where the recursion relation $$ z_{n+1} = z_n^2 + c $$ is bounded as $n \to \infty $, and $ z_0 = 0 $. That is, a point $c$ is in the Mandelbrot set if $ |z_n | \leq 2 $ for all $n >0$.
Code
I started by writing a function that checks if a complex point c = $ ( x_c, iy_c ) $ is in the Mandelbrot set. Since we are dealing with complex points $ z_n = ( x_z, iy_z ) $, we have $$ | z_n | \leq 2 \iff \sqrt{x_z^2 + y_z^2} \leq 2 \iff x_z^2 + y_z^2 \leq 4 $$
as the condition to remain in the Mandelbrot set. In the code I check if the condition is broken. Similarly, when we expand, we get $$ z_n^2 = ( x_z^2 - y_z^2, i 2 x_z y_z) $$
Then, when we check the next iterative step $z_{n+1}$ and update our values of $x_z$ and $y_z$, we say $$ x_{z, n+1} = x_z^2 - y_z^2 + x_c \qquad y_{z, n+1} = 2 x_z y_z + y_c $$
Using these relations, the function looks like this:
Mandelbrot Code
@njit(parallel = True)
def mandelbrot(cx, cy, max_iters):
    '''
    Checks if a complex number (represented by pixel (x, iy)) is in the mandelbrot set.
    Calculates zn+1 = zn^2 + c
    Returns the number of iterations before breaking. If max_iters is returned, c is in the set
    --------
    cx: float - Re(c)
    cy: float - Im(c)
    max_iters: int - Max number of iterations to be in the set
    '''

    ### Starting at the point (0,0i),
    zx = 0.0
    zy = 0.0

    for i in prange(max_iters):
        # Mandelbrot Condition to break out
        if zx**2 + zy**2 > 4:
            return i

        # Update
        zx, zy = zx**2 - zy**2 + cx, 2*zx*zy + cy

    return max_iters
It's pretty straightforward, we keep evaluating the Mandelbrot condition for each iteration until we get to max_iters. If the condition is broken, then we know that the recursion relation at that point is unbounded, and we return the number of iterations it took for the condition to break. Otherwise, if we go all the way to the end, we return max_iters and that point is in the Mandelbrot set.
Then, we need to use the mandelbrot function on every point in our complex plane. This is defined in a function called eval_mandelbrot and looks like this:
Code to Evaluate the Mandelbrot Function
def eval_mandelbrot(
    height, width, x_start, y_start, x_end, y_end, max_iters:int):
    '''
    Evaluates mandelbrot function for each point in the complex plane
    Returns a NumPy array with the number of iterations as elements
    --------
    height: int - height of the array / image
    width: int - width of the array / image
    x_start: float - Start point on the x (real) axis
    x_end: float - End point on the x (real) axis
    y_start: float - Start point on the y (imaginary) axis
    y_end: float - End point on the y (imaginary) axis
    max_iters: int - Max number of iterations to for criterion into the set
    '''

    # Define our axes
    x = np.linspace(x_start, x_end, width)
    y = np.linspace(y_start, y_end, height)

    result = np.zeros((width, height, 3))
    for i, cx in enumerate(x): # Rows
        for j, cy in enumerate(y):
            res = mandelbrot(cx,cy, max_iters)
            colour = colouring(res, max_iters)
            result[i,j] = colour

    # results array needs to be uint8 when using PIL to generate image
    return np.uint8(result)


def colouring(n, max_iters):
    '''
    Returns a list of length 3 defining a colouring in HSV format
    '''
    hue = int(255 * n / max_iters)
    saturation = 255

    if n < max_iters:
        colour = [hue, saturation, 255]
    else:
        colour = [hue, saturation, 0]

    return colour
This is also pretty straightforward. I define two axes, iterate over them to check each point, and keep the results in a 3D NumPy results array. The reason why I used a 3D array instead of a 2D array has to do with the colouring of the final image, since we want points with a similar number of iterations to have similar colours. The results array holds the HSV colour scheme of each pixel / point in the picture. Also, I was too lazy to figure out the colouring so I found some a code snippet online and wrapped it in a function which I called ```colouring```.
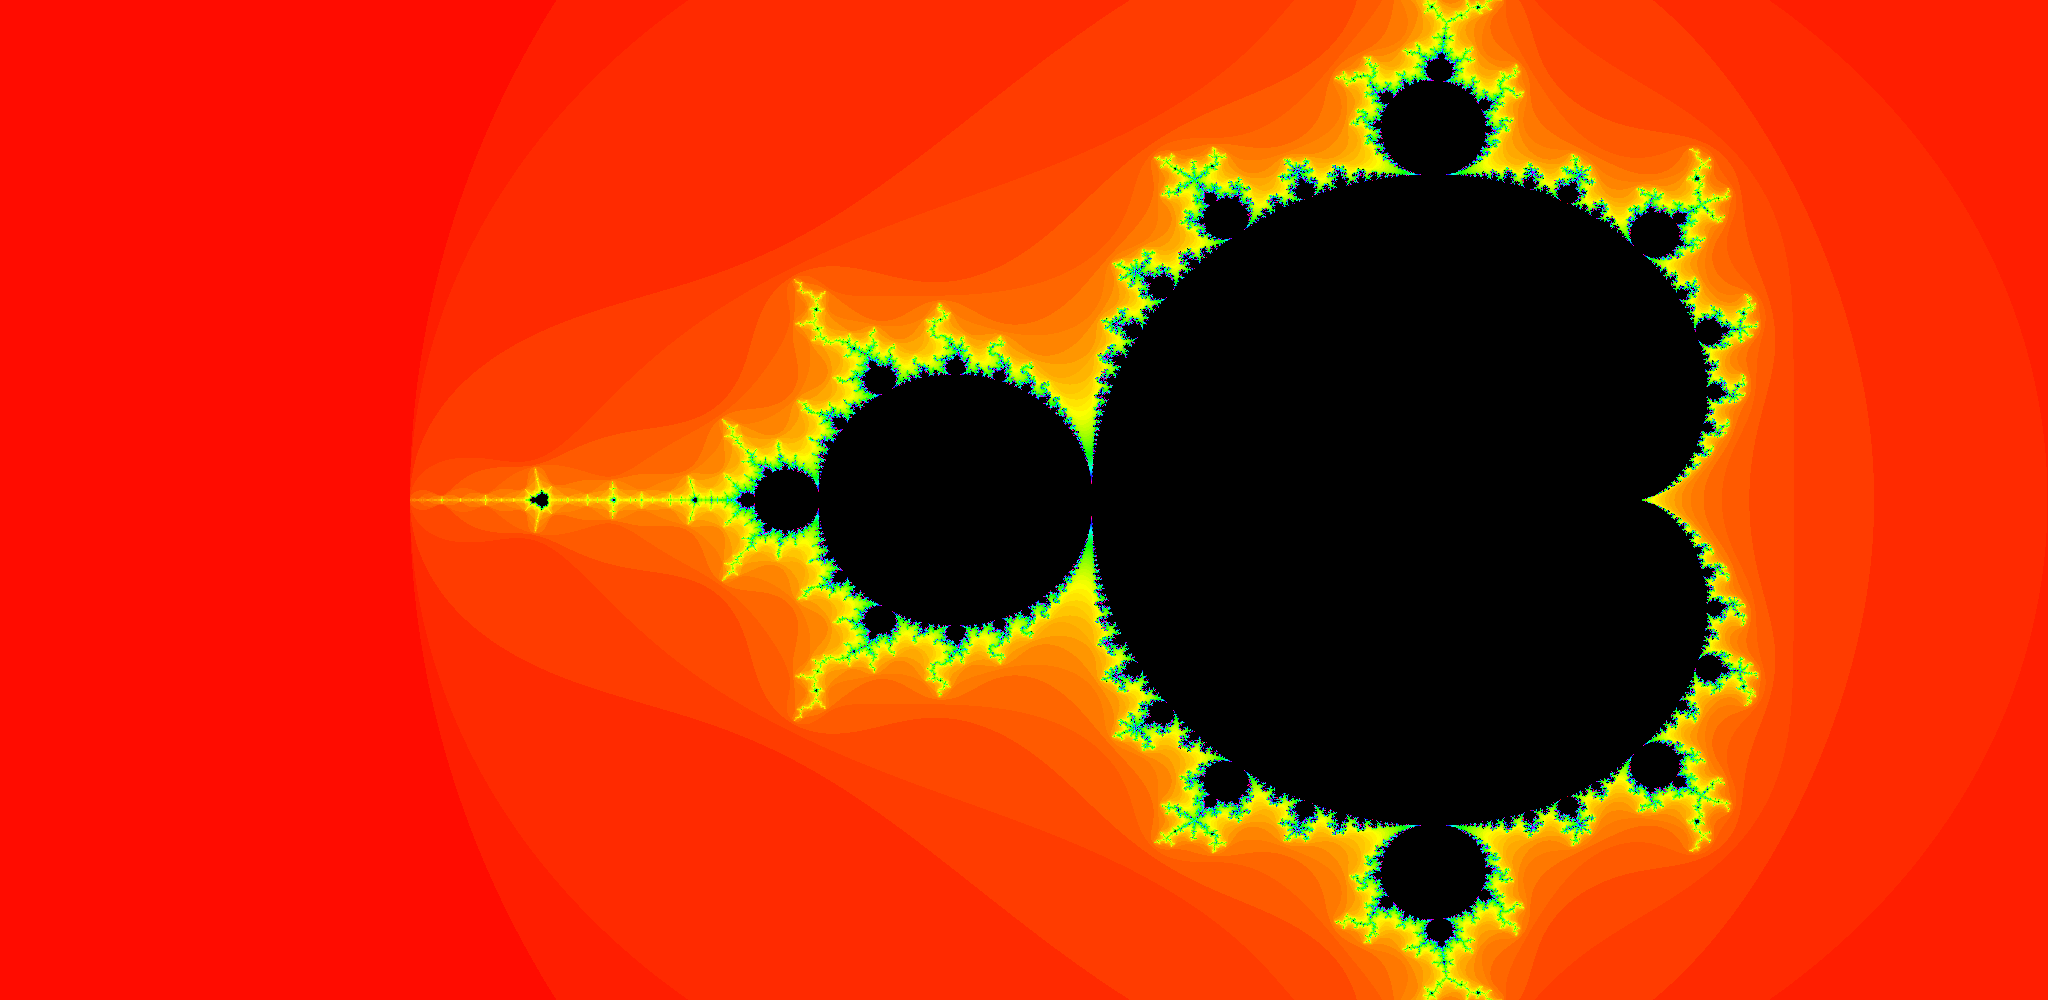
Then, using the eval_mandelbrot function, I made a PIL image object and generated a static image over
over the region (x_start, y_start) = (-2.75, -1.00), (x_end, y_end) = (1.00, 1.00) with height = 1000, width = 2048 and max_iters = 100.

I also checked how the Mandelbrot set forms as the number of iterations increases.

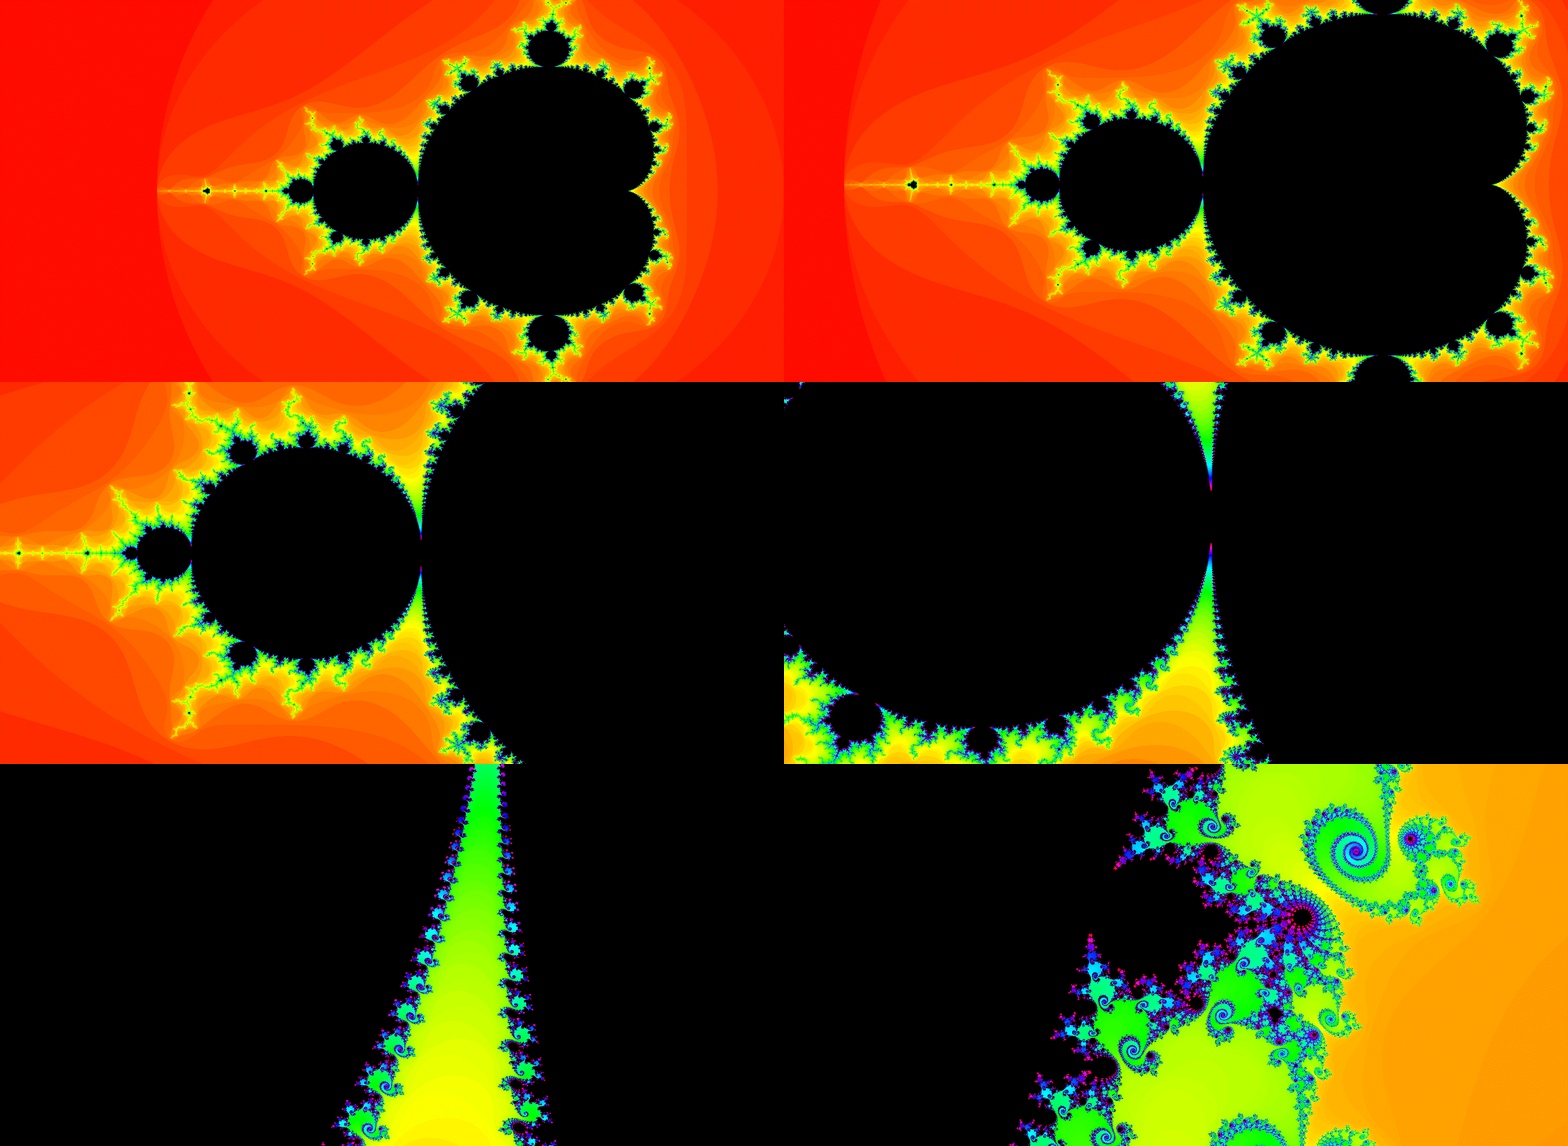
Lastly, I thought it would be cool to zoom in a little and see how complex the Mandelbrot set can be.
